BRING CITIZEN SCIENCE DATA TO LIFE - WITH THE NEW "DATA VISUALIZATION OVERLAY" |
|
|---|
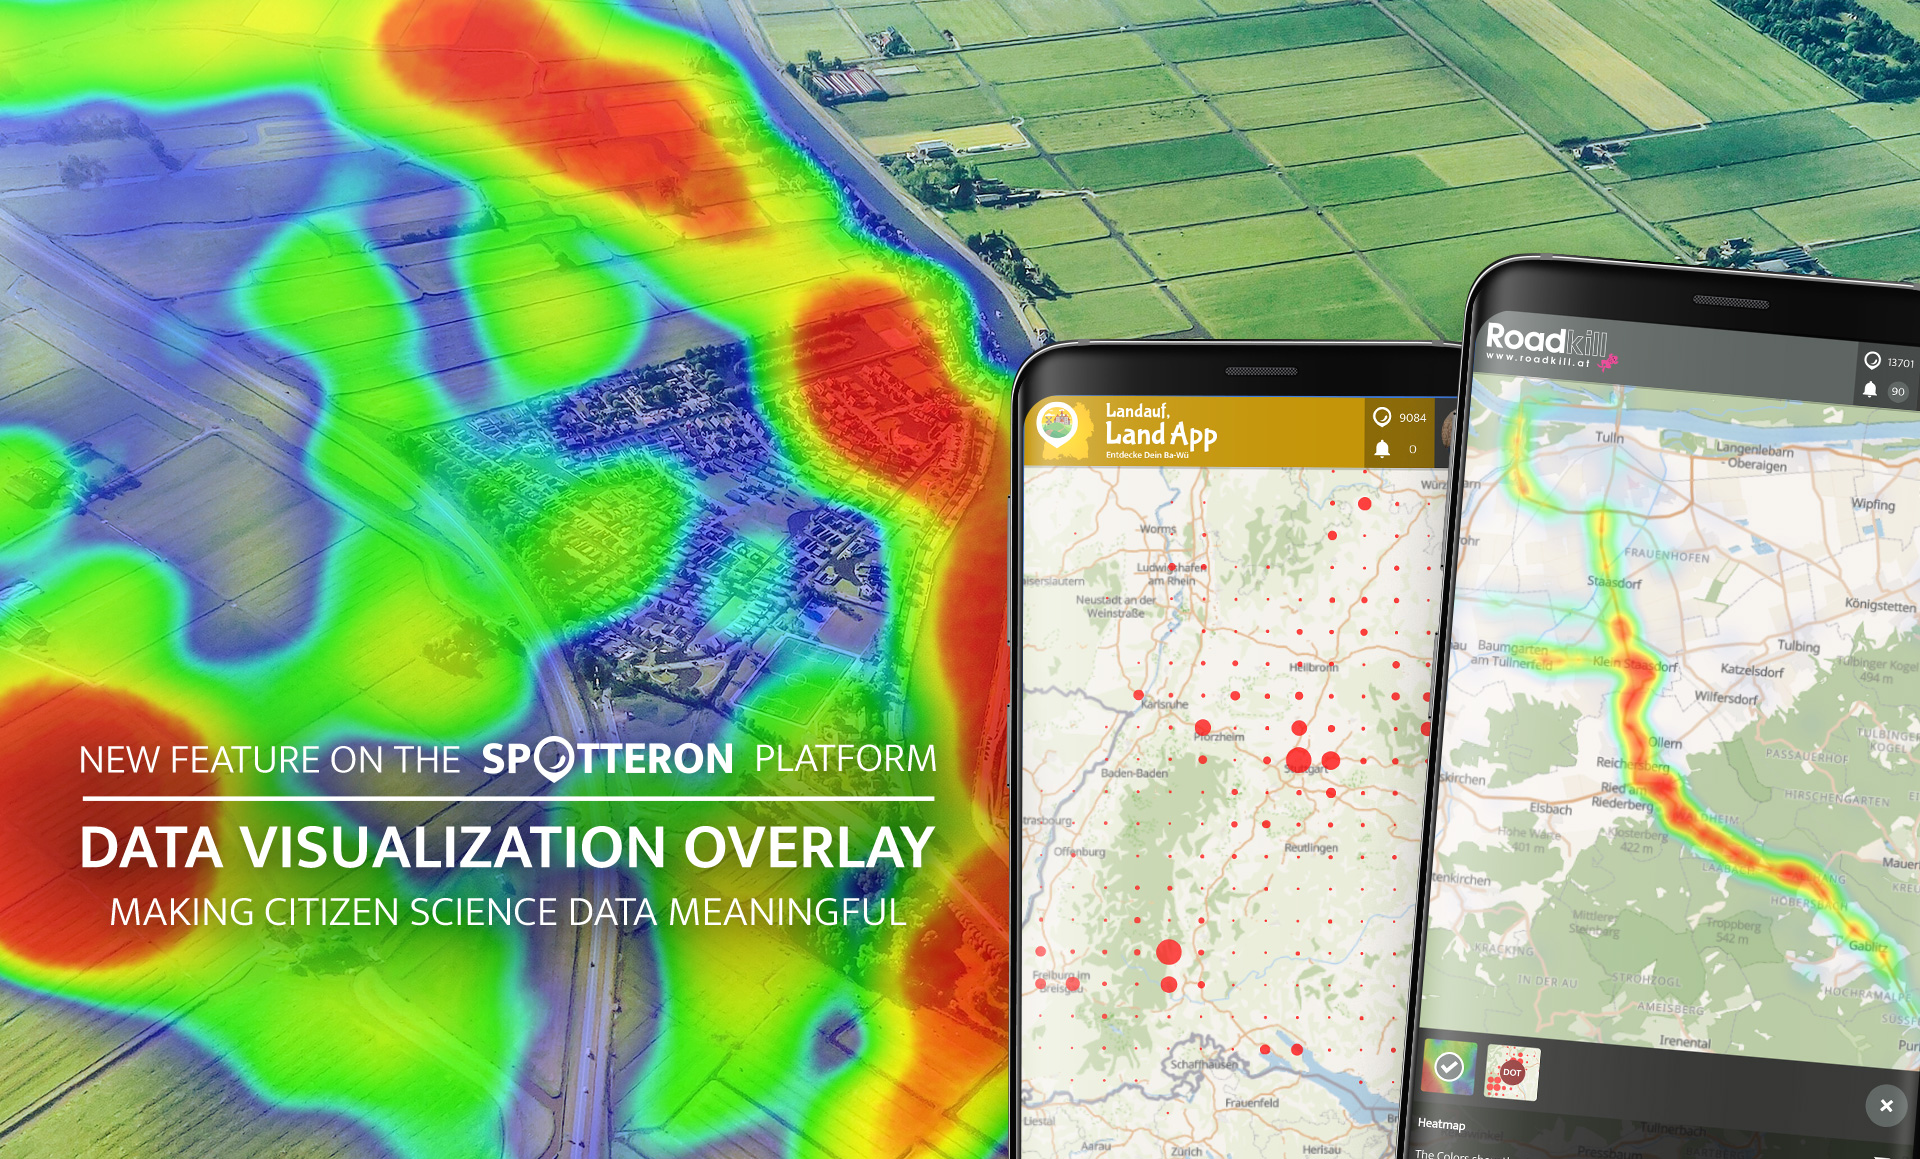
The new "Data Visualization Overlay" brings interactive data visualizations to all Citizen Science Apps on the SPOTTERON Platform. Significant relationships are illustrated with one click and presented in a visually appealing way.
|
|
|---|
Data visualization makes it possible to show relationships, patterns and trends in data and to gain new insights from them. It helps to communicate information clearly and efficiently, makes complex issues more understandable and is ultimately a fusion of scientific data and design.
By presenting data in its entirety, new insights can be gained. Especially in Citizen Science Apps with a spatial reference, visualizations directly embedded in the map offer the possibility of better understanding data and relating one's contributions to the whole data set of the project. |
|
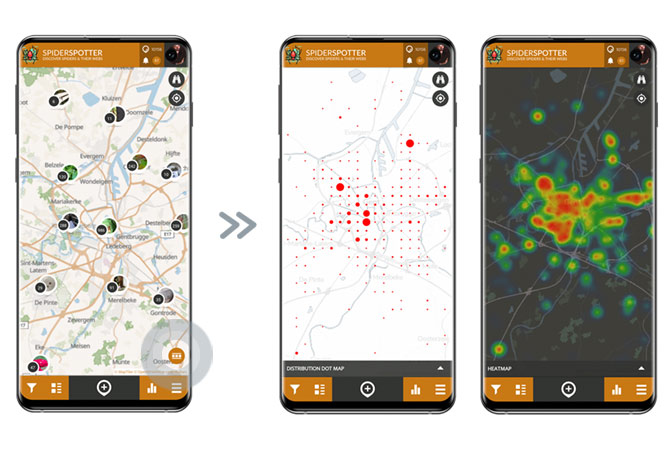
To this end, we have now integrated a new interface directly into the map display for all project apps on the SPOTTERON Platform. The new feature can be activated at any time by tapping on the interface icon. This opens an interactive map overlay that displays the contributions in the project in the form of different data visualizations. The visualizations adapt seamlessly to each zoom level or to moving the map.
At the start of the new feature, there are currently already two types of data visualizations to choose from in all apps: a "Heatmap", which shows the density of spots in colour gradations on the map, and a "Distribution Dot Map", where the distribution of spots is resolved in a grid with the size of a circle representing the number of posts. But this is just the beginning - more extensive and complex overlays will be added here in the future. |

|
|
|
Extendable and flexible: Custom Data Visualizations for your Citizen Science App
The underlying extensibility of the new "Data Visualization Overlay" enables the implementation of new, individual data visualizations. As with the features for Citizen Science Apps, once implemented, all other projects can freely use new visualization options on the platform without additional development costs. |
|
|---|
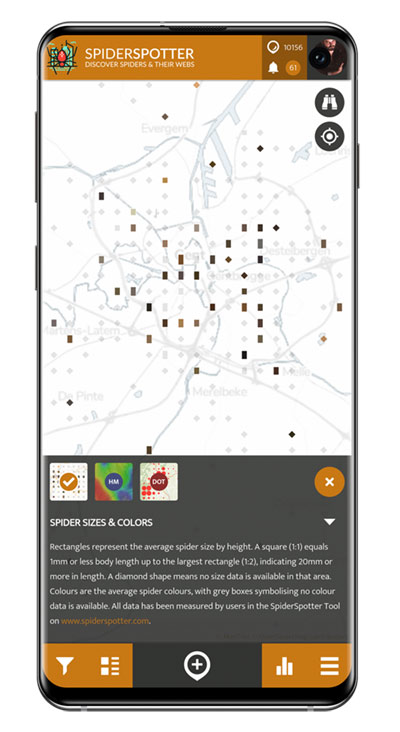
A first project-specific visualization can be found in the Citizen Science App "SpiderSpotter". In the project, spiders are observed to investigate the effects of climate change on their sizes and colours. Together with the University of Ghent in Belgium, we have implemented an interactive visualization of measurement data, that has been collected by Citizen Scientists in the project's specially developed Data Analysis Tool on the map. The Citizen Scientists can thus become active on several levels in "SpiderSpotter" - from data collection to data analysis to researching measured values in their environment.
Future enhancements will include interactive elements that allow the display of specific species and their distributions and time-slider functionality to monitor changes over time. |
| |
|---|
|
|
Phenology Projects on the SPOTTERON Citizen Science Platform |
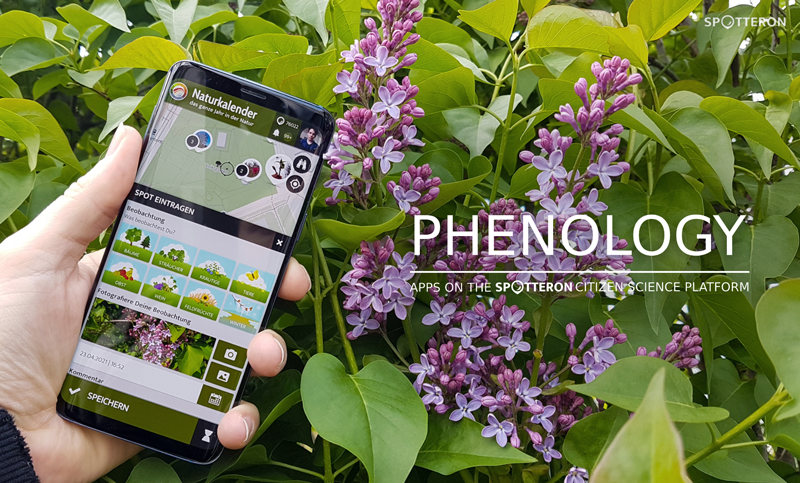
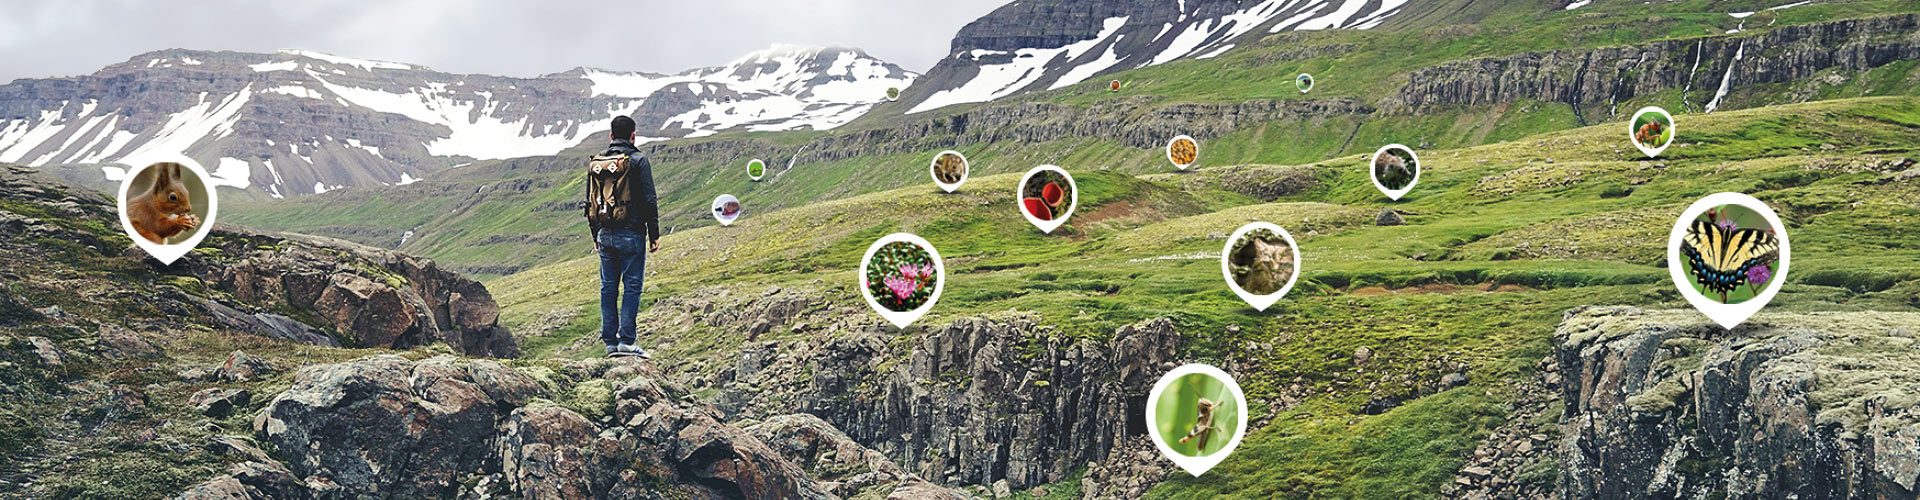
At SPOTTERON, we create Citizen Science apps for a variety of science fields. One of the most exciting topics is phenology - the study of periodically recurring phenomena in nature's annual cycle - and how global warming affects the developmental stages of animals and plants. Learn more about the Nature's Calendar ZAMG and ClimateWatch Australia - the two major phenology projects on the platform ...
READ MORE >> |
|
|
|
|
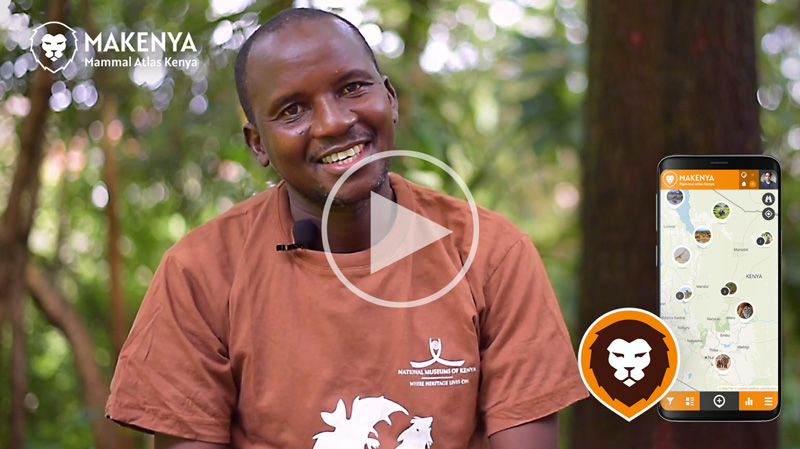
Citizen Science connecting Continents - Researcher Simon Musila about the importance of a Mammal Monitoring App in Kenya |
In this video article, Simon Musila from the Mammal Section of the National Museums of Kenya speaks to 'Nature Kenya' about the importance of monitoring mammals in Kenya and why it is essential to use modern mobile application technology in scientific research to involve a wide range of participants with collecting relevant data - in the first African Citizen Science App running on the SPOTTERON Platform - MAKENYA ...
WATCH THE VIDEO >> |
|
|
|
| Newsletter and E-Mail Subscriptions for your Project
| For Citizen Science projects that want to get in touch with their users via newsletters, SPOTTERON offers an "e-mail subscription" feature any project on the platform can utilize right from the start ...
READ MORE >> |
|
| |
| The integrated Offline-Mode for Citizen Science Apps
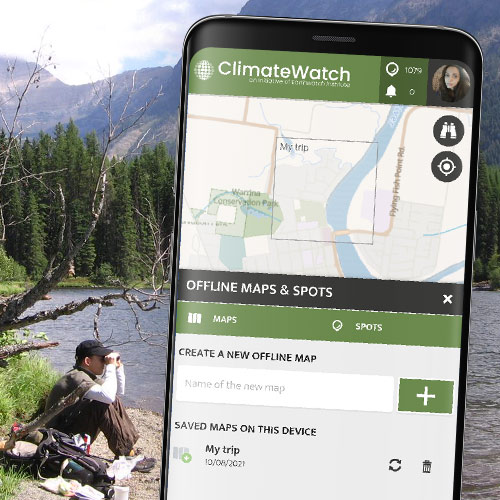
| It is possible to use all SPOTTERON Apps at locations without an internet connection. Thanks to the "Offline Maps & Spots" function, sightings can be recorded offline and stored locally on the smartphone ... READ MORE >> |
| Wie es sich anfühlt ein CitizenScientist zu sein (und einen bedeutsamen Fund zu machen) | |
|
|---|
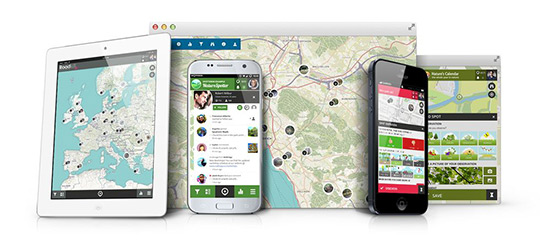
JOIN UP FOR CITIZEN SCIENCE START YOUR PROJECT ON SPOTTERON | | | Your own Citizen Science project should run on a stable and reliable basis. SPOTTERON provides a modern and innovative platform for your custom Smartphone Apps and Interactive Maps for your website - all bundled into fixed price-packages with app updates, ongoing maintenance and regular updates.
| | |
|
|---|
|
Stay safe and best regards from Vienna! Your SPOTTERON Citizen Science Team |
|
|
|
|
|
|
|