But Citizen Science should not only consist of data contributions. Besides community and communication activities, all Apps on the SPOTTERON platform utilise a wide range of interactive features in the Community Pack; engaging Citizen Scientists in further data analyses can be an inclusive and effective endeavour. We have developed a unique and innovative toolkit for such purposes, which allows participants from the Citizen Science App to log in and help with advanced data analysis like size measurements or colour references.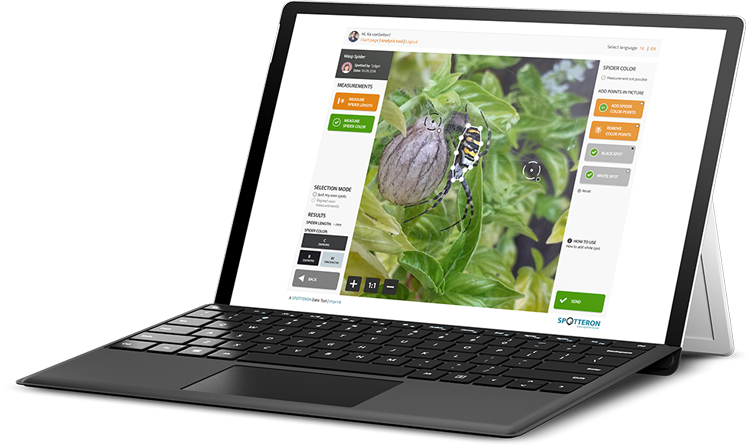
Citizen Science Data Analysis together with the Community
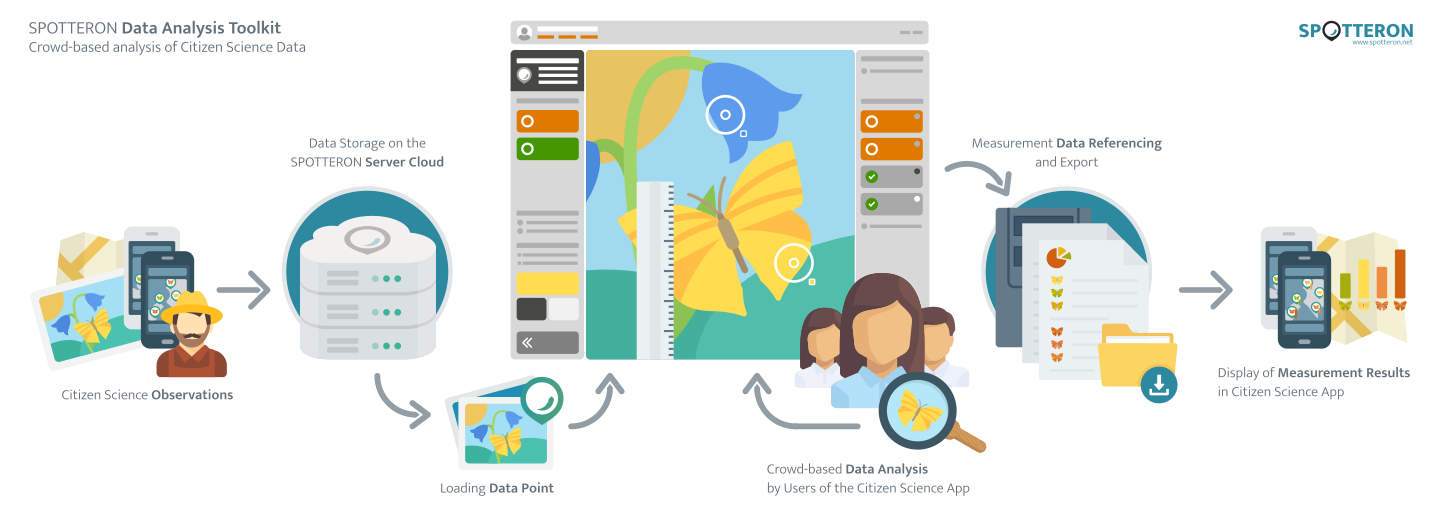
First, put to use in the SpiderSpotter Citizen Science project, the SPOTTERON Data Analysis Toolkit consists of an extendable stable framework for an easy-to-use software application, which is interconnected with the Citizen Science App of a project. Collected data from the Citizen Science App is included live in the toolkit's data-set and is made available for analysis by the participants.
Citizen Scientists, school classes or even people not participating in the Citizen Science App can log in and apply various project-specific tools to the picture of a data point. Users can e.g. make measurements, extract colour information from a butterfly or flower, present in the photograph by an App user. After one picture has been analysed by a user, the added data is stored on submitting and the next data object with its picture is loaded. The added data is accessible for the project's research team as download and can be cross-referenced with the data export from the SPOTTERON Citizen Science App.
The Data Analysis Toolkit is designed to provide a fun and fulfilling experience for its users, making adding data to Citizen Science contributions easy and entertaining. The analysed data is also ready for download as a CSV file for a user's own contributions in the Citizen Science App. This allows Citizen Scientists and groups or school classes to first collect observations in an App, then analyse and work with the data, download the data for their App contributions and create their own scientific workflow.


http://www.spotteron.net/custom-citizen-science-tools/data-analysis-toolkit#sigProId10b3e041ee
Custom data tools for Citizen Science projects
The Data Analysis Toolkit's interface allows the integration of custom tools on a per-project basis. True to the SPOTTERON spirit of a collaborative environment between Citizen Science projects, all already available tools can be used by a new project without extra development costs. New tools for measurements and crowd-based data analysis can be developed by our team and made ready for your Citizen Science project.Example tools from live Citizen Science projects consist of:
Size measurements
Colour extractor
Quality feedback
We can always extend the selection of available tools in the Data Analysis Toolkit's interface with new measurement methodologies or new innovative ways to work with Citizen Science-based data. For custom feature expansion with new tools, our development team stands ready to assist.

Embeddable and ready for use in the Citizen Science website
The Data Analysis Toolkit can be directly embedded in the Citizen Science project's website, providing easy accessibility for everyone interested in the project's topic. Also, by direct integration in the project's homepage, the link to the Data Analysis Toolkit can be shared via messages, Social media, or a Newsletter.
Extendable Data Analysis for all Citizen Science projects
The Data Analysis tool framework has been developed from the start with reusability in mind. Citizen Science projects, which want to utilise the power of crowd-based data analysis, can build on the toolkit's stable framework without having to fund the development of the underlying software again - only the development of new tools and runtime/maintenance fees need to be calculated for. This allows projects to bring their own tool to the software toolkit and to extend the number of available tools for all other projects on the platform. With more options and features coming in, the Data Analysis Toolkit can process a wider arrange of Citizen Science data and offer new possibilities for participants to help with the research project.
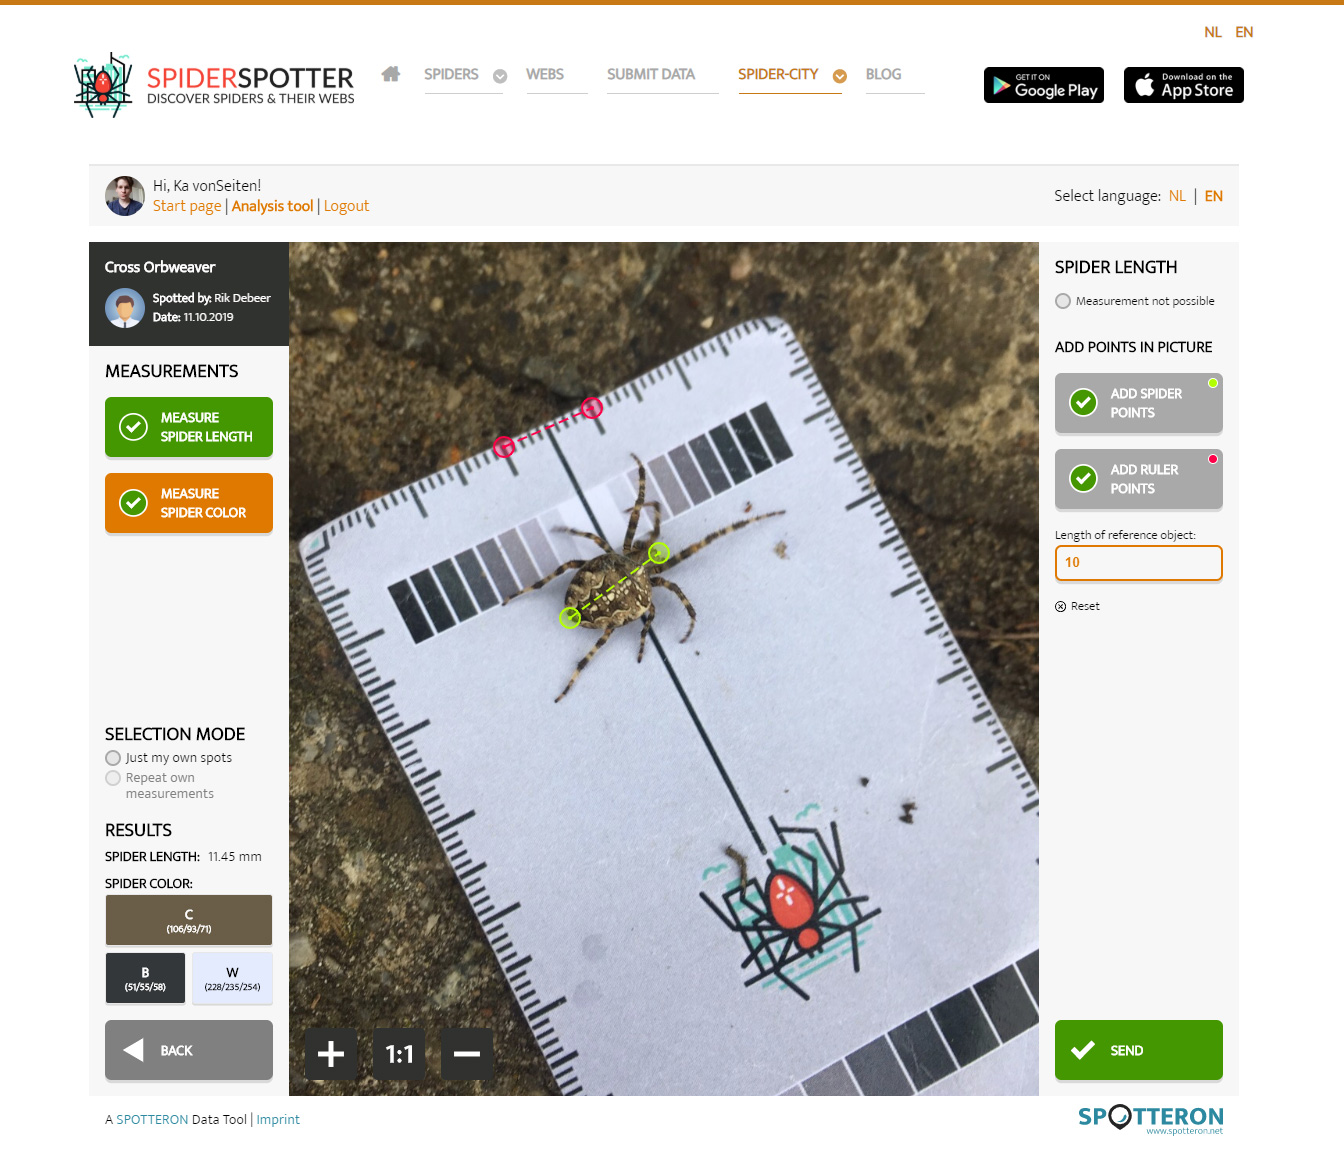
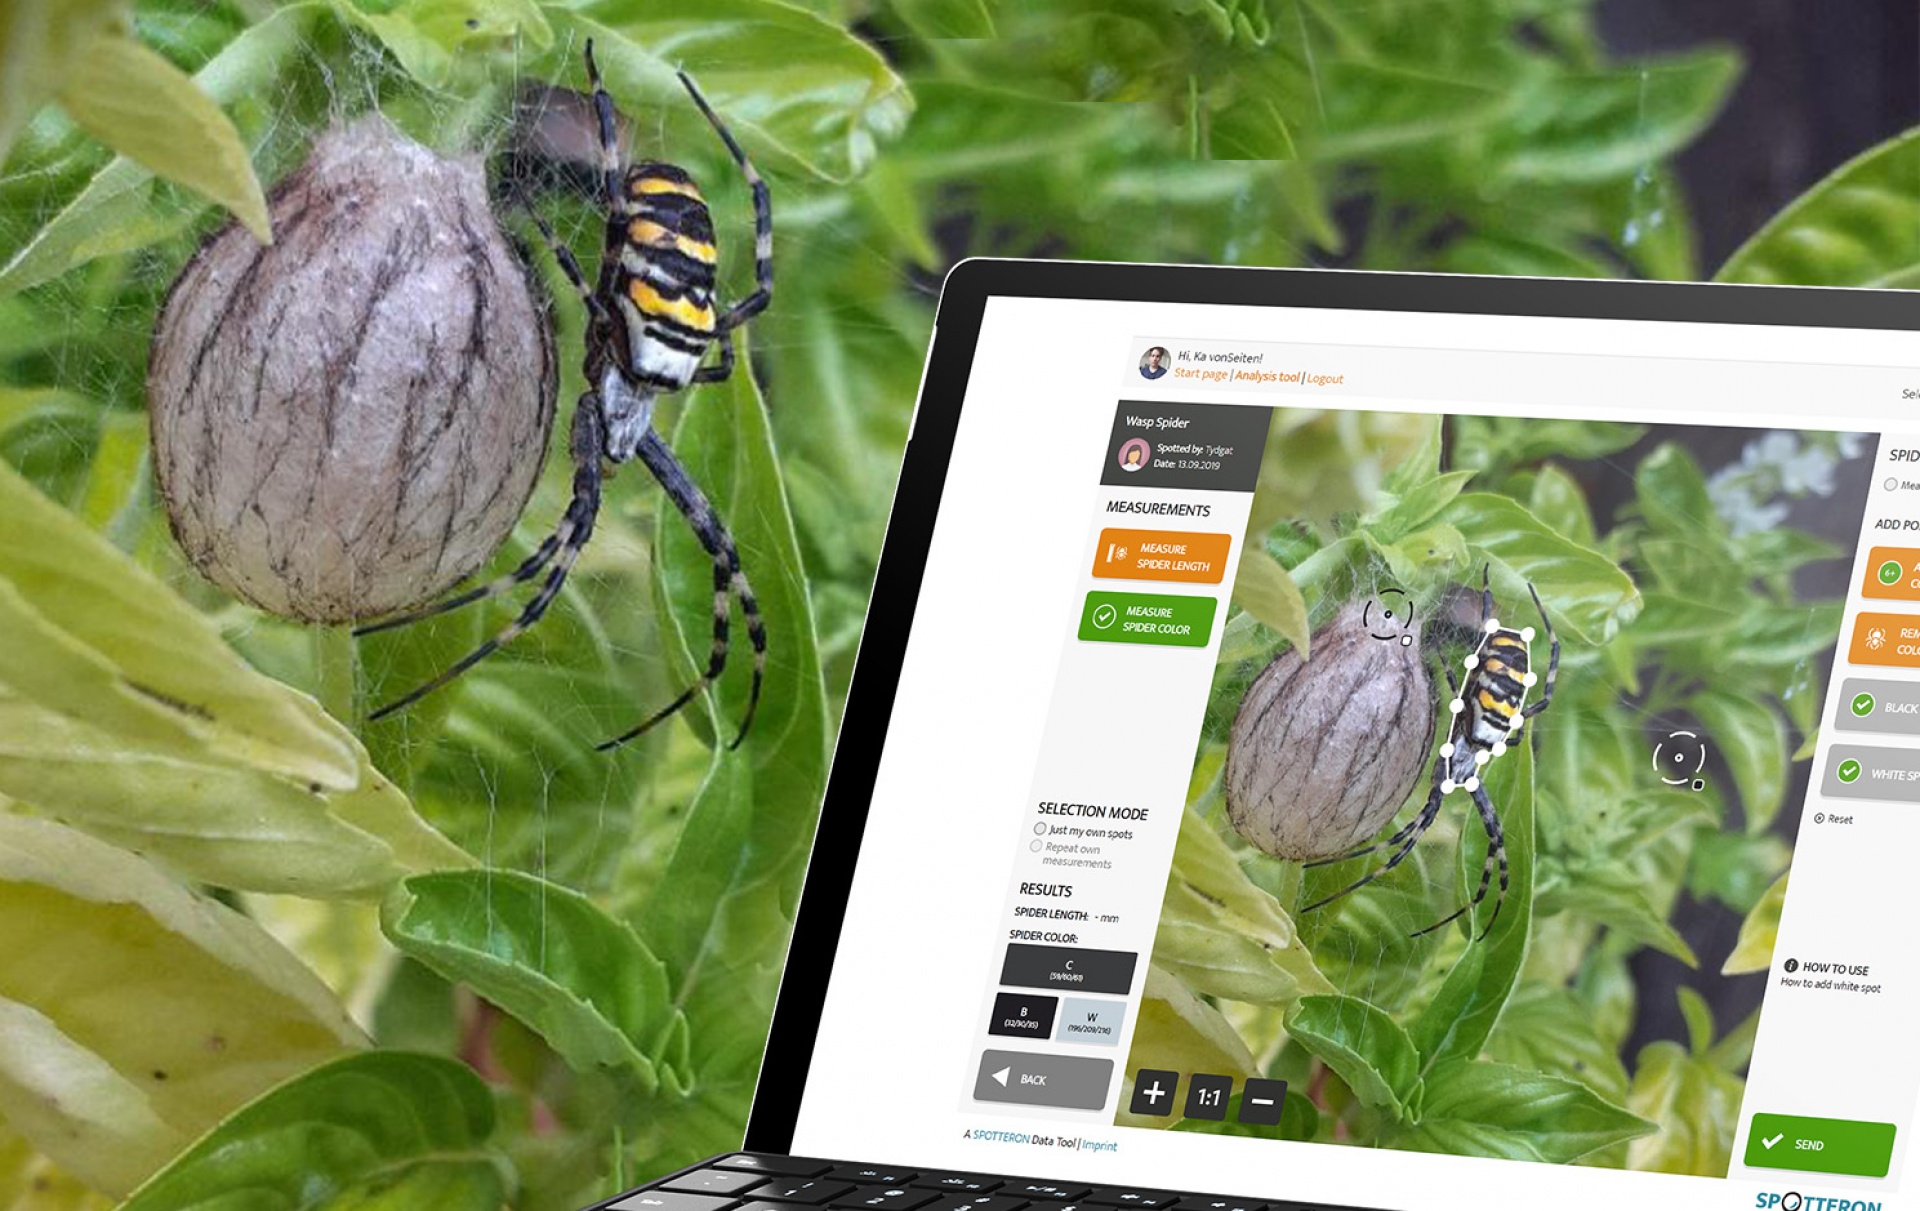
Measuring Spiders together with the App Community
In the case of the SpiderSpotter Project, photographs of spider species from the Citizen Science App's data points are made available in the Data Analysis Toolkit's interface for the measurement of sizes and colours. Participants can create reference length for the spider's body and a present everyday object or ruler placed in the picture. The length of the spider's body is then automatically calculated by the toolkit and stored in the database. In a second measurement, users can draw a polygon shape around the spider's body, and the toolkit automatically calculates the average colour value of the spider in RGB. The SpiderSpotter project involves school classes directly in Citizen Science, allowing them to export their own data and make own analysis.
http://www.spotteron.net/custom-citizen-science-tools/data-analysis-toolkit#sigProId10b3e041ee
Crowd-based Data Analysis as a collaboration platform
With the Data Analysis Toolkit, Citizen Science projects can take their outline one step further and integrate Citizen Scientists in data collection and working with the data. Participants can provide measurements in an intuitive and user-friendly interface.
If you are interested in Citizen Science Data Analysis for your own project, or want a live demonstration, please reach out with a quick email