
SPOTTERON
Edit profile function for users to update information or profile picture
Of course, users can always update and edit their profile information and pictures. They can simply go to their profile in the apps and directly edit it there.
Own user types for humans, school classes and organizations
The different user types we offer for individuals, school classes or organization are not just practical to have, they also allow to avoid legal issues (for example, when school kids collect data).
User profile with profile picture, info-section and "My observations" panel
Every user of your app gets a profile with the possibility to upload a profile picture and add information. But note, none of this is required to participate. Further, users can see all observations they collected through the "My observations" panel in their profile.

Privacy first: no user tracking
We value privacy! That's why there is no form of user tracking involved in the use of any phone or web-based SPOTTERON apps.
Partner and Sponsor Branding Options
Of course, we have different options available for you to brand your apps with your project identity and (in case this applies) also with sponsor logos.
Top user ranking list
Another feature included in your apps: Top user ranking. You and your users can see which 10 users collected most data. This way, you can thank diligent users for contributing, and other users will be encouraged to collect more data.
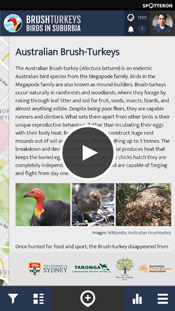
Custom information panel with media elements
Every project's app and an interactive map includes an information area for content like the project description, information about the topics of observations, media elements (pictures, graphics, link to online videos) and more. The information panel's content is working even without an internet connection and is always accessible.
Multi language ready
All apps are multi-language ready. Two languages are always included in the app setup, but we can add as many as you need as long as you provide us with the translations.
Statistic panels per spot for charts display based on observation values
For spots with updates, the statistics panel shows the observation value development over time through chart displays. This visualization of data can be shown for different time frames like a week, month, quarter or even year.
Update mode: users can add new observations to the same location
The update mode allows users to add new data in a location where data has already been collected. Thereby you can collect valuable data over time, which shows the development of an observed object, plant, etc.