Citizen Science Data Statistics: a new SPOTTERON app feature for realtime data visualization

Monday, 29 April 2019 20:00

The new SPOTTERON version 2.7 does not only introduce the new Leaderboards (aka User Ranking) for all Citizen Science apps running on the platform, but also 2 more panels with new data statistics.

On SPOTTERON, every app gets all features of the platform without any additional costs. This principle not only made it possible to implement a full social network, push messages, an offline mode and much more advanced functionalities into every Citizen Science app, it also provides a complete and modern Citizen Science toolkit for users and project scientists alike which is bigger than all its parts. Two new extension just have been finished with the new app update version 2.7 and released for every Citizen Science project on the SPOTTERON platform: first the Community leaderboards (with their own blog entry here) and secondly the new Data Statistic Panels.

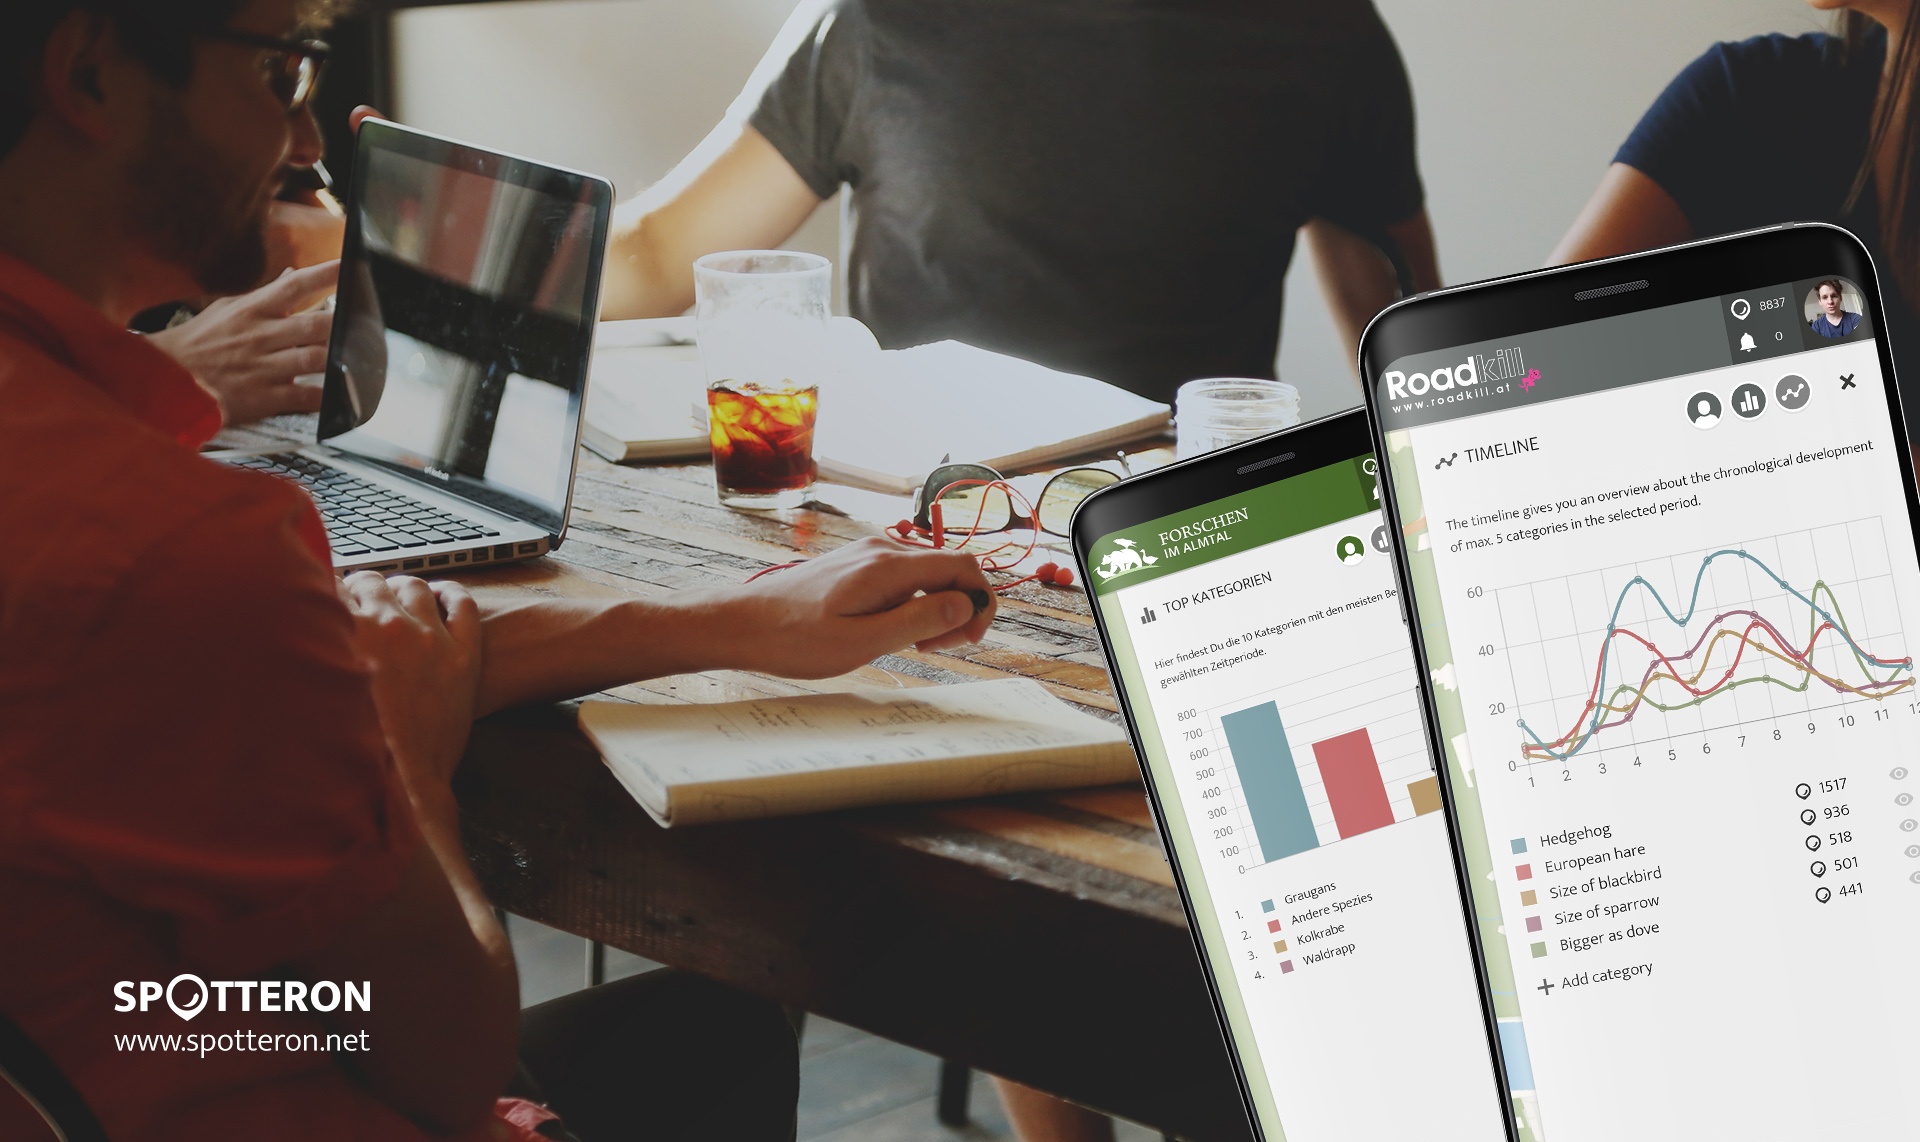
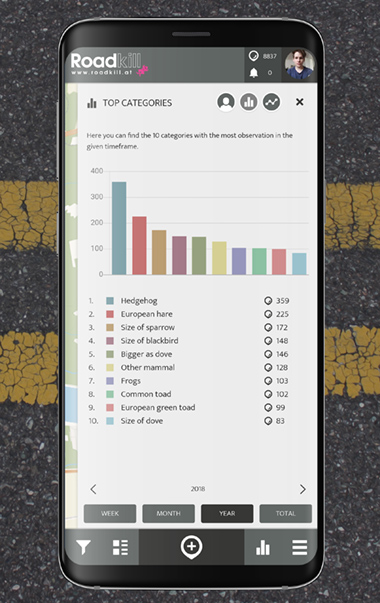
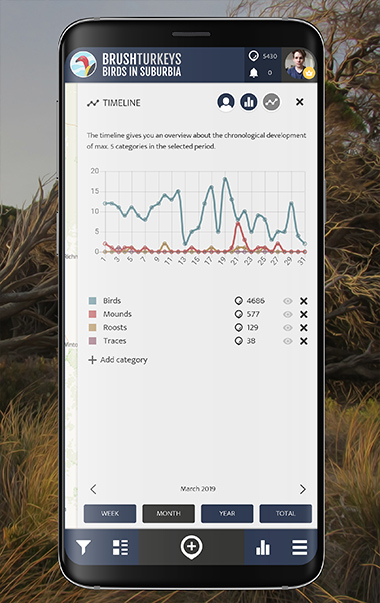
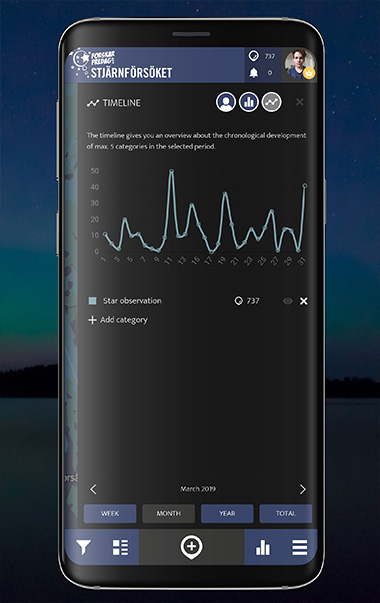
The "Top categories" panel shows which 10 categories in the app have been spotted most in the selected timeframe, while the second panel "Timeline" features a configurable display of the Citizen Scientist's contributions in a chronological way with a line chart. 5 categories from the Citizen Science app can be chosen by the users and then are displayed in form of an interactive line chart in the panel.

In this panel, Users can hide / unhide categories, which results in an instant animated update of the chart. Furthermore, the data points can be selected and the amount of observations are displayed.

For both panels, the time range displayed can be switched and the data statistics are updated in realtime. It is also possible to switch through the different time areas with arrow buttons to see data statistics from e.g. the last month or the week before.

Citizen Science Data Visualization

The new data statistics give instant feedback to all participants about what kind of species, topics or observation options are contributed through out time by the community in the Citizen Science app. Especially the "Timeline" panel can be used to explore the data on a chronological scale to see e.g. the impact of the seasons in a biology monitoring project on particular animals, fungi or plants or to explore how the project has grown until now in the "Total" time range option.

SPOTTERON CitizenScienceStatisticPanel 01 RK SPOTTERON CitizenScienceStatisticPanel 02 BT SPOTTERON CitizenScienceStatisticPanel 03 SC

The new statistics provide a modern and visually elegant form of realtime data visualization and can be accessed in any Citizen Science app on the SPOTTERON platform with the second icon from the right in the main interface bar or via the main menue. The panels are also present in the projects' interactive web-app, which is automatically part of every toolkit package, for example directly under this link: https://www.spotteron.com/naturkalender/statistics by using the bubble buttons or by swiping the panel itself.

TEST A CITIZEN SCIENCE APP TO SEE IT LIVE

Projects & Apps open for Co-Use on SPOTTERON

App Icon
Social initiative Data Collection App
SPOTTERON

ArtSpots is a community-built art atlas. Through the App, people interested in various art forms like street art, historical or contemporary art, photography, architecture, and more can put their art observations on the map and discover art spots in their city or while travelling. The art community in the App allows exchanging with other like-minded people and contributing to a worldwide art collection.
Learn more about
ArtSpots
App Icon
Horizon Europe Citizen Science App

With the COSEA App, Citizen Scientists can observe marine environments, document coastal habitats or species, and report on pollution, infrastructure and the blue economy. Their contributions on the map and activity in the app will help scientists better understand the impacts and drivers of marine factors to protect and foster a healthy relationship between humans and seas.

Learn more about
COSEA | Collaboration for Effective Sea Action
App Icon
Environmental Citizen Science, Data Collection App
SPOTTERON

NatureSpots is a non-commercial and free project to discover nature together. In the app, nature photos and sightings of animals, plants or mushrooms can be shared with the community on the map. The app is a new initiative for observing nature and taking part is very simple and straightforward. The app is free of advertising, does not track users and takes digital privacy seriously.

Learn more about
NatureSpots
App Icon
Social initiative Community Engagement App
SPOTTERON

The new citizen participation uses "Citizen Science" in their hometown and nationwide to get User's feedback on places. As a result, citizens are empowered to become active in a city worth living in to collect and share data themselves and to interact with scientists. This enables them to recognize the consequences of sealing, heat, water shortages, and a lack of biodiversity, and generally, how places in their own environment affect us all.

Learn more about
CIVO Citizen Voice
App Icon
Horizon 2020 Invasive Species Monitoring App

The IPM-Popillia Horizon 2020 project aims to address the challenge of a new risk to plant health in Europe's agriculture and food safety: the invasion of the Japanese Beetle, Popillia japonica. This invasive species was introduced accidentally to mainland Europe in 2014 and can quickly spread by transportation and trade. As a species with a wide range of feeding plants, P. japonica threatens the entire agricultural sector, urban landscapes, and biodiversity in invaded areas.

Learn more about
IPM Popillia | Integrated Pest Management of the Japanese Beetle
App Icon
Environmental Community Engagement App

Fridays for Future see itself as a horizontal, grassroots grassroots movement that acts apolitically and refers to science for the facts. To engage the global population more, this app was developed using SPOTTERON. The aim is to find out how the population perceives the climate crisis and which positive and negative emotions are associated with specific topics related to biodiversity and climate crisis.

Learn more about
FRIDAYS FOR FUTURE - Climate App

Are you interested in co-using existing Apps? Get in Contact!

Get in contact for co-use here


Short News

  • New study from BiciZen project: "BiciZen: Lessons in the Development of a Crowdsourcing Mobile App to Make Cities More Bikeable" published in Journal of Participatory Research Methods. More studies available under the publication page here.

    in Shortnews
  • Roadkill project has made wonderful short videos for the citizen scientists! The videos include the Roadkill App functions regarding how to confirm & comment on the spots and how to best take the photos for the project. The videos (in German) are available in the "Österreich forscht" blog here. 

    in Shortnews

Newsletter

Please enable the javascript to submit this form